No. 02 — Charts
Charts that join the conversation.
Ask for a chart. Get the levels and annotations that explain it.

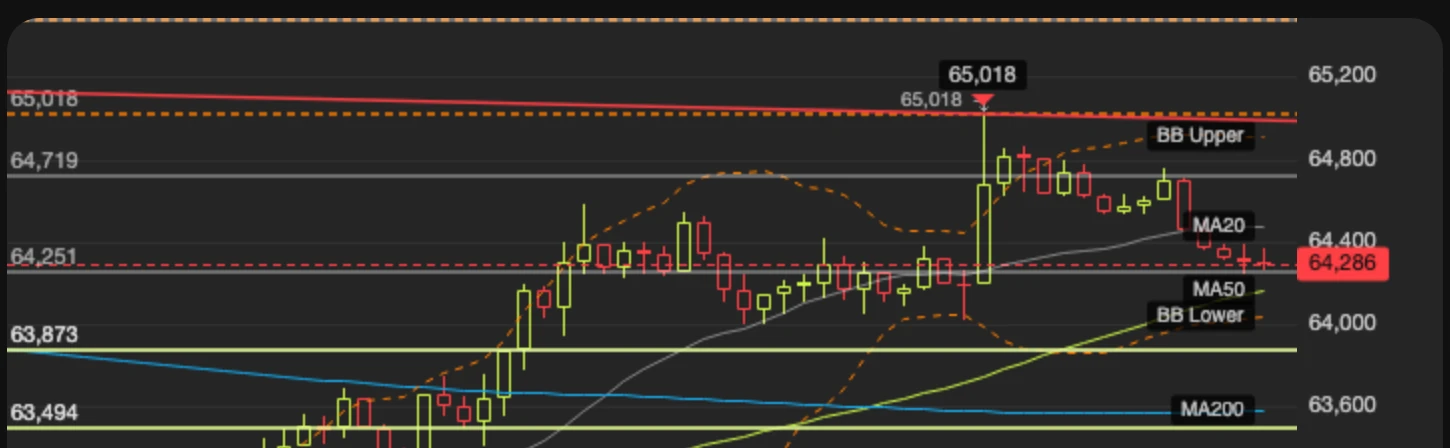
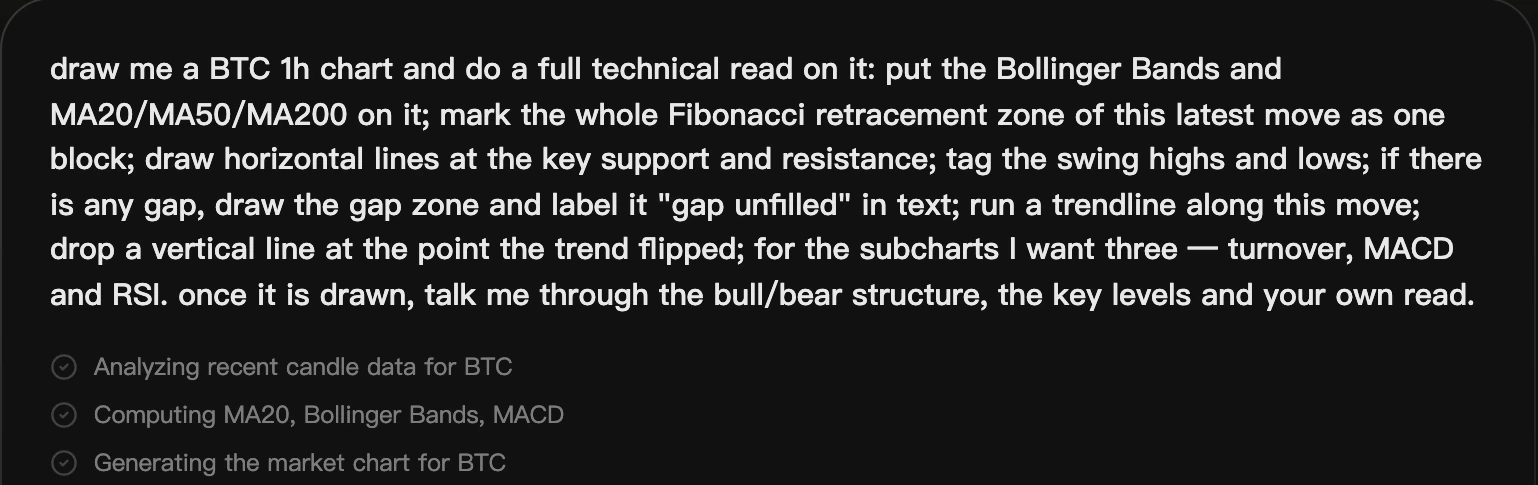
Try asking“Chart BTC on the 4-hour timeframe and mark the key levels.”
How it works: See the setup.
Mojo produces interactive candlestick charts from your request, with annotations tied to the price data. Explore timeframes and inspect the levels that matter to your analysis.
- I.
Request indicators and technical annotations in natural language.
- II.
Zoom and change the timeframe in the product.
- III.
Use the chart to refine the question, then your plan.
Field note — know the limits
Supported chart types and data coverage vary. A chart explains a setup; it does not predict a guaranteed outcome.
Source: official Mojo documentation ↗ · Reviewed 7 October 2026.
A place to start
“Chart BTC on the 4-hour timeframe and mark the key levels.”
An example to explore the product, not a trading recommendation.



No. 02 — Charts: Your next move starts here.
Ask in a sentence. Review the plan. Decide what runs.
Web · iOS · Android